The Financial Ticker Performance dashboard was developed as a freelance project for a client. With this idea, I decided to scale it in order to incorporate additional indicators and tickers. This project started in January 2026 and is still under development to continue adding more data.
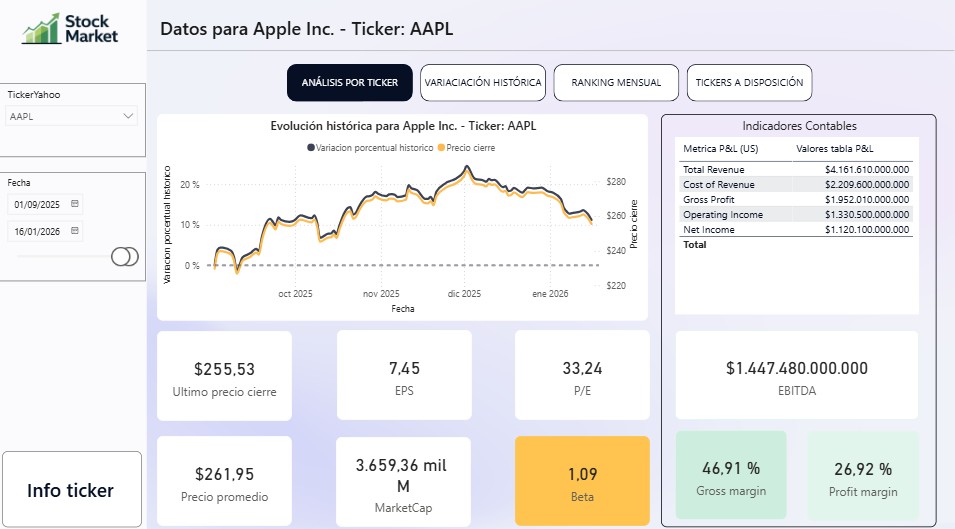
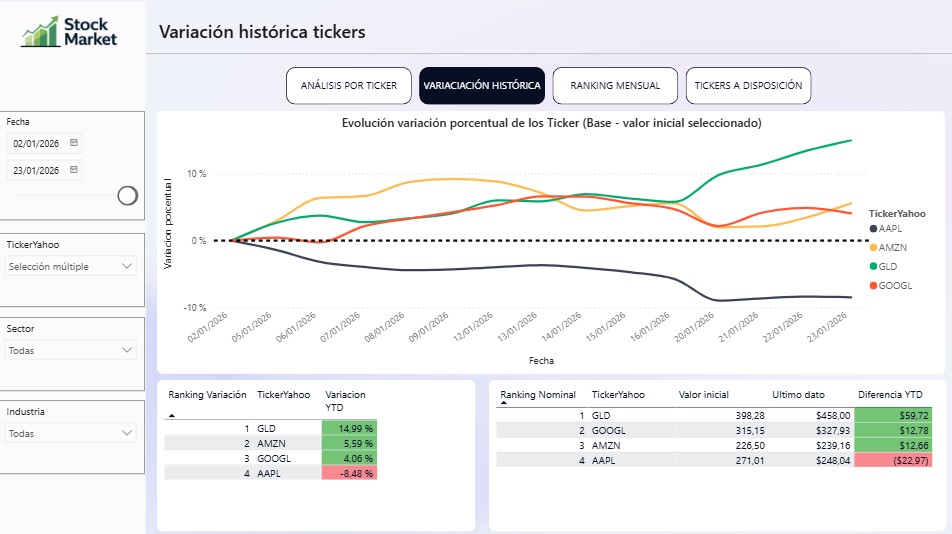
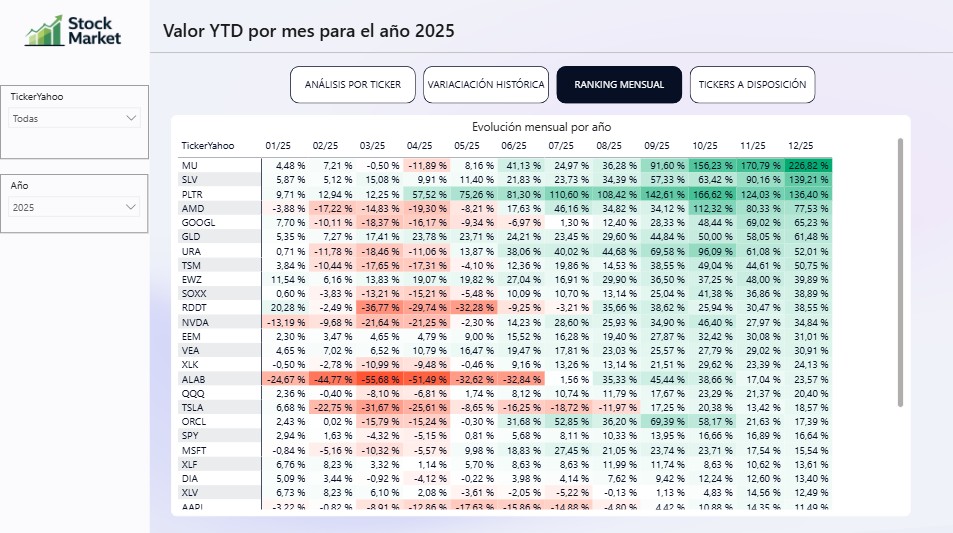
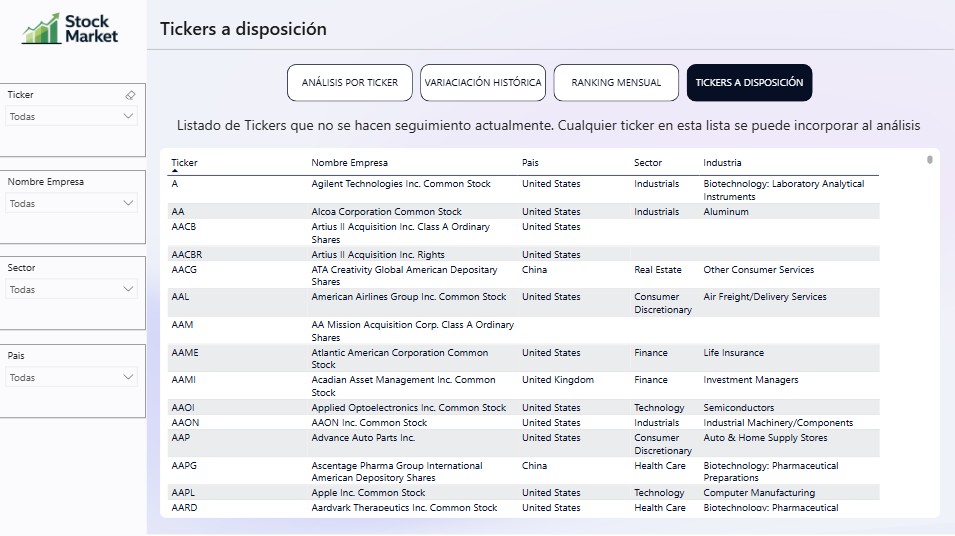
It contains information for multiple tickers, allowing historical value analysis. It uses a Python library from Yahoo Finance to retrieve the data. Then, an ETL process was carried out using the Pandas library in Python to clean the data and subsequently build the dashboard in Power BI. The dashboard includes price data, volume, and financial metrics to estimate a P&L.
GO TO THE DASHBOARD